cut17 pbh1 bir1
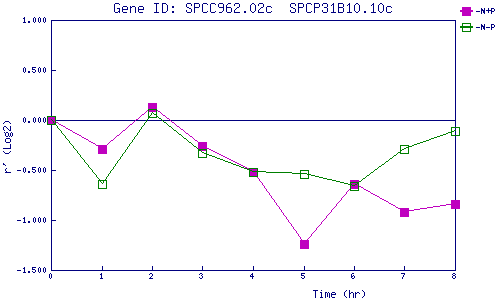
| 0 | 1 | 2 | 3 | 4 | 5 | 6 | 7 | 8 | |
| -N+P | 0.000 | -0.294 | 0.129 | -0.258 | -0.515 | -1.240 | -0.642 | -0.915 | -0.845 |
| -N-P | 0.000 | -0.635 | 0.072 | -0.328 | -0.520 | -0.535 | -0.657 | -0.292 | -0.112 |
|
-N+P: Nitrogen starved in the presence of P-factor -N-P: Nitrogen starved in the absence of P-factor |