| 0 | 1 | 2 | 3 | 4 | 5 | 6 | 7 | 8 | |
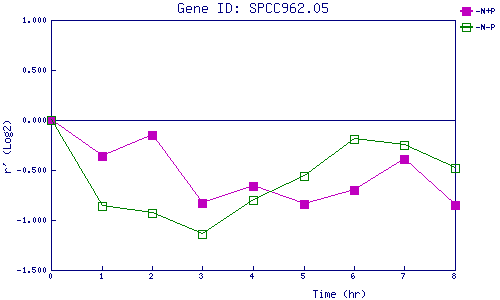
| -N+P | 0.000 | -0.361 | -0.152 | -0.834 | -0.665 | -0.840 | -0.703 | -0.391 | -0.847 |
| -N-P | 0.000 | -0.860 | -0.929 | -1.144 | -0.803 | -0.558 | -0.186 | -0.254 | -0.475 |
|
-N+P: Nitrogen starved in the presence of P-factor -N-P: Nitrogen starved in the absence of P-factor |