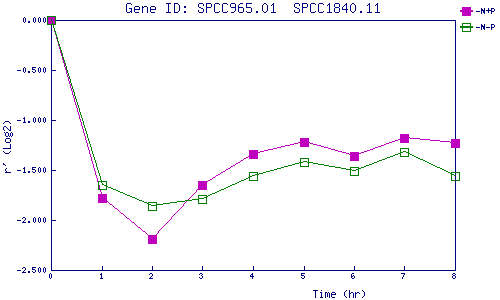
| 0 | 1 | 2 | 3 | 4 | 5 | 6 | 7 | 8 | |
| -N+P | 0.000 | -1.782 | -2.189 | -1.646 | -1.338 | -1.220 | -1.357 | -1.183 | -1.229 |
| -N-P | 0.000 | -1.646 | -1.857 | -1.791 | -1.563 | -1.422 | -1.514 | -1.315 | -1.557 |
|
-N+P: Nitrogen starved in the presence of P-factor -N-P: Nitrogen starved in the absence of P-factor |