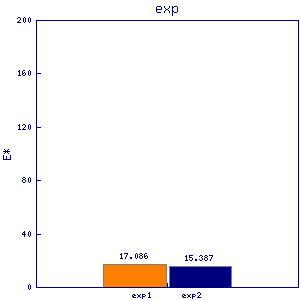
thp1
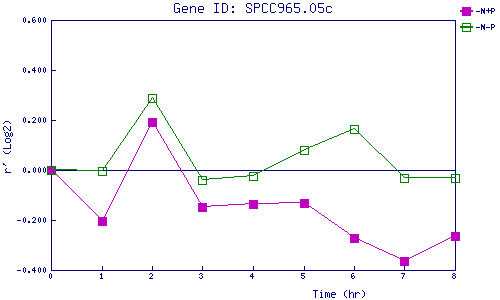
| 0 | 1 | 2 | 3 | 4 | 5 | 6 | 7 | 8 | |
| -N+P | 0.000 | -0.205 | 0.192 | -0.148 | -0.134 | -0.131 | -0.270 | -0.363 | -0.263 |
| -N-P | 0.000 | -0.005 | 0.286 | -0.041 | -0.023 | 0.080 | 0.165 | -0.032 | -0.032 |
|
-N+P: Nitrogen starved in the presence of P-factor -N-P: Nitrogen starved in the absence of P-factor |