rad16 rad10 rad20 swi9
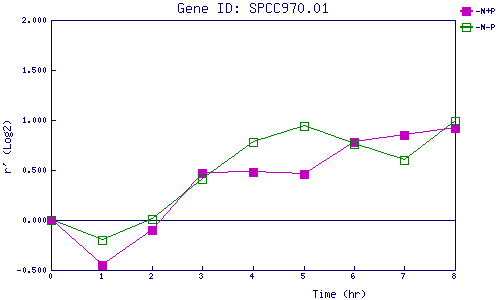
| 0 | 1 | 2 | 3 | 4 | 5 | 6 | 7 | 8 | |
| -N+P | 0.000 | -0.449 | -0.096 | 0.473 | 0.478 | 0.460 | 0.785 | 0.853 | 0.925 |
| -N-P | 0.000 | -0.201 | 0.014 | 0.413 | 0.775 | 0.944 | 0.759 | 0.605 | 0.988 |
|
-N+P: Nitrogen starved in the presence of P-factor -N-P: Nitrogen starved in the absence of P-factor |