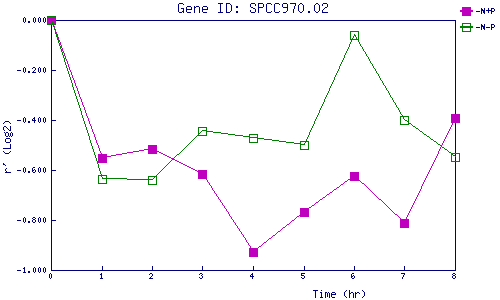
| 0 | 1 | 2 | 3 | 4 | 5 | 6 | 7 | 8 | |
| -N+P | 0.000 | -0.550 | -0.515 | -0.614 | -0.930 | -0.767 | -0.624 | -0.811 | -0.391 |
| -N-P | 0.000 | -0.635 | -0.638 | -0.444 | -0.473 | -0.501 | -0.059 | -0.399 | -0.548 |
|
-N+P: Nitrogen starved in the presence of P-factor -N-P: Nitrogen starved in the absence of P-factor |