| 0 | 1 | 2 | 3 | 4 | 5 | 6 | 7 | 8 | |
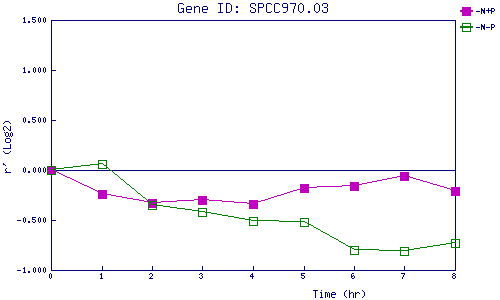
| -N+P | 0.000 | -0.239 | -0.333 | -0.300 | -0.343 | -0.184 | -0.161 | -0.064 | -0.214 |
| -N-P | 0.000 | 0.063 | -0.350 | -0.415 | -0.513 | -0.518 | -0.800 | -0.813 | -0.729 |
|
-N+P: Nitrogen starved in the presence of P-factor -N-P: Nitrogen starved in the absence of P-factor |