rpl36-1 rpl3601
| 0 | 1 | 2 | 3 | 4 | 5 | 6 | 7 | 8 | |
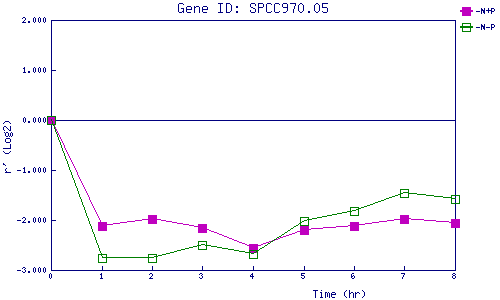
| -N+P | 0.000 | -2.115 | -1.977 | -2.152 | -2.563 | -2.191 | -2.127 | -1.982 | -2.066 |
| -N-P | 0.000 | -2.762 | -2.759 | -2.506 | -2.679 | -2.027 | -1.820 | -1.453 | -1.589 |
|
-N+P: Nitrogen starved in the presence of P-factor -N-P: Nitrogen starved in the absence of P-factor |
