| 0 | 1 | 2 | 3 | 4 | 5 | 6 | 7 | 8 | |
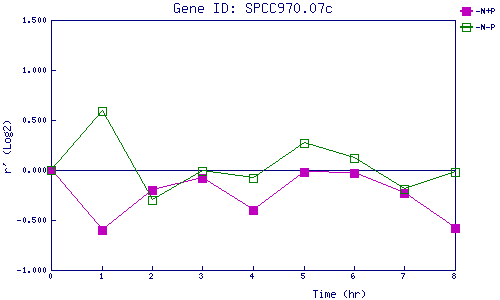
| -N+P | 0.000 | -0.600 | -0.200 | -0.083 | -0.401 | -0.018 | -0.026 | -0.229 | -0.581 |
| -N-P | 0.000 | 0.587 | -0.304 | -0.007 | -0.078 | 0.271 | 0.118 | -0.191 | -0.024 |
|
-N+P: Nitrogen starved in the presence of P-factor -N-P: Nitrogen starved in the absence of P-factor |
