| 0 | 1 | 2 | 3 | 4 | 5 | 6 | 7 | 8 | |
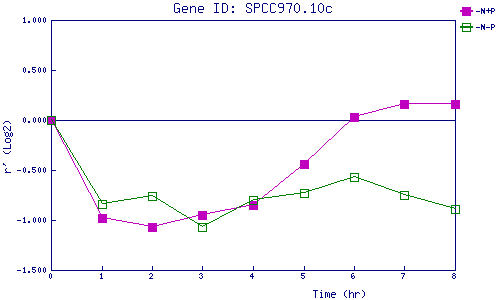
| -N+P | 0.000 | -0.975 | -1.070 | -0.949 | -0.853 | -0.437 | 0.029 | 0.159 | 0.157 |
| -N-P | 0.000 | -0.837 | -0.761 | -1.066 | -0.800 | -0.730 | -0.570 | -0.746 | -0.889 |
|
-N+P: Nitrogen starved in the presence of P-factor -N-P: Nitrogen starved in the absence of P-factor |