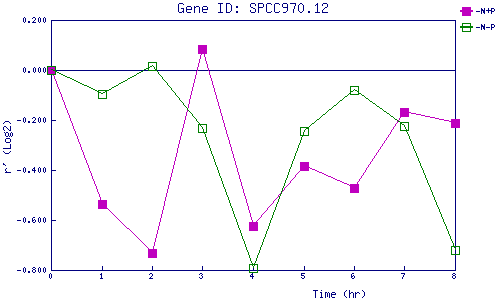
| 0 | 1 | 2 | 3 | 4 | 5 | 6 | 7 | 8 | |
| -N+P | 0.000 | -0.535 | -0.733 | 0.085 | -0.625 | -0.385 | -0.474 | -0.167 | -0.213 |
| -N-P | 0.000 | -0.097 | 0.015 | -0.230 | -0.792 | -0.245 | -0.082 | -0.225 | -0.722 |
|
-N+P: Nitrogen starved in the presence of P-factor -N-P: Nitrogen starved in the absence of P-factor |