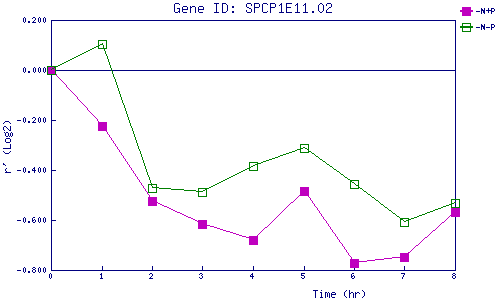
| 0 | 1 | 2 | 3 | 4 | 5 | 6 | 7 | 8 | |
| -N+P | 0.000 | -0.226 | -0.524 | -0.614 | -0.682 | -0.483 | -0.773 | -0.748 | -0.570 |
| -N-P | 0.000 | 0.102 | -0.474 | -0.490 | -0.385 | -0.314 | -0.455 | -0.606 | -0.531 |
|
-N+P: Nitrogen starved in the presence of P-factor -N-P: Nitrogen starved in the absence of P-factor |