apl4
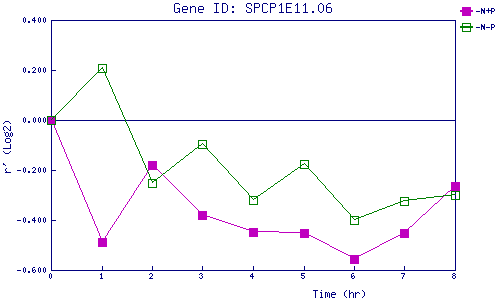
| 0 | 1 | 2 | 3 | 4 | 5 | 6 | 7 | 8 | |
| -N+P | 0.000 | -0.488 | -0.180 | -0.381 | -0.446 | -0.453 | -0.557 | -0.453 | -0.264 |
| -N-P | 0.000 | 0.207 | -0.253 | -0.098 | -0.320 | -0.174 | -0.399 | -0.324 | -0.300 |
|
-N+P: Nitrogen starved in the presence of P-factor -N-P: Nitrogen starved in the absence of P-factor |