cwf18
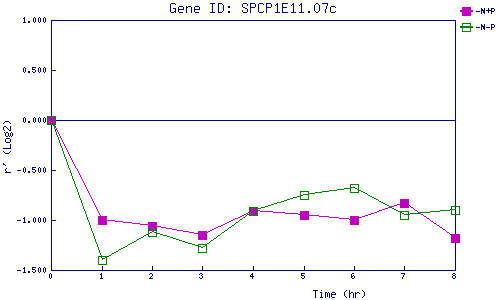
| 0 | 1 | 2 | 3 | 4 | 5 | 6 | 7 | 8 | |
| -N+P | 0.000 | -0.996 | -1.065 | -1.146 | -0.913 | -0.949 | -0.997 | -0.833 | -1.184 |
| -N-P | 0.000 | -1.404 | -1.119 | -1.277 | -0.907 | -0.754 | -0.680 | -0.947 | -0.899 |
|
-N+P: Nitrogen starved in the presence of P-factor -N-P: Nitrogen starved in the absence of P-factor |