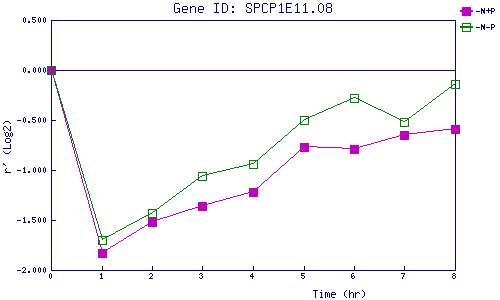
| 0 | 1 | 2 | 3 | 4 | 5 | 6 | 7 | 8 | |
| -N+P | 0.000 | -1.829 | -1.522 | -1.364 | -1.220 | -0.767 | -0.788 | -0.647 | -0.592 |
| -N-P | 0.000 | -1.705 | -1.431 | -1.062 | -0.942 | -0.498 | -0.279 | -0.520 | -0.136 |
|
-N+P: Nitrogen starved in the presence of P-factor -N-P: Nitrogen starved in the absence of P-factor |