rpp103 rpp1-3
| 0 | 1 | 2 | 3 | 4 | 5 | 6 | 7 | 8 | |
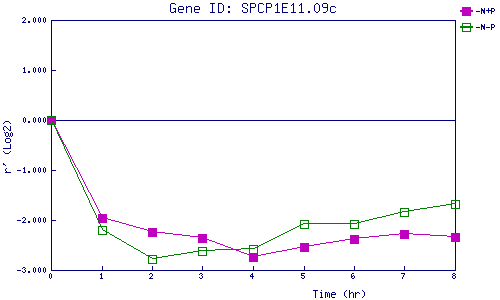
| -N+P | 0.000 | -1.961 | -2.244 | -2.363 | -2.731 | -2.538 | -2.381 | -2.283 | -2.338 |
| -N-P | 0.000 | -2.210 | -2.783 | -2.616 | -2.587 | -2.085 | -2.075 | -1.845 | -1.682 |
|
-N+P: Nitrogen starved in the presence of P-factor -N-P: Nitrogen starved in the absence of P-factor |