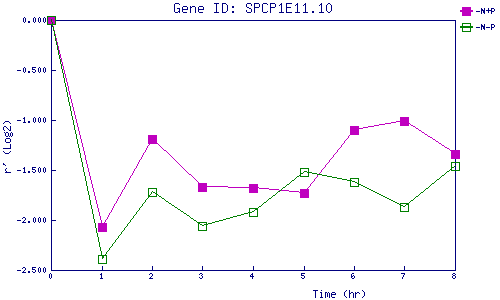
| 0 | 1 | 2 | 3 | 4 | 5 | 6 | 7 | 8 | |
| -N+P | 0.000 | -2.074 | -1.190 | -1.672 | -1.677 | -1.735 | -1.103 | -1.006 | -1.339 |
| -N-P | 0.000 | -2.392 | -1.716 | -2.061 | -1.919 | -1.525 | -1.620 | -1.867 | -1.460 |
|
-N+P: Nitrogen starved in the presence of P-factor -N-P: Nitrogen starved in the absence of P-factor |