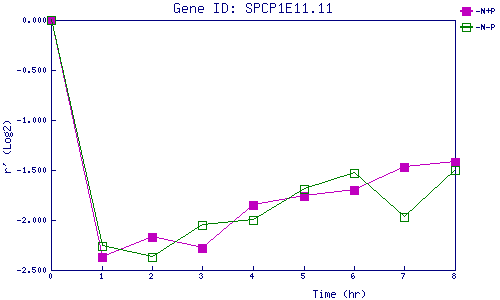
| 0 | 1 | 2 | 3 | 4 | 5 | 6 | 7 | 8 | |
| -N+P | 0.000 | -2.369 | -2.170 | -2.284 | -1.849 | -1.758 | -1.704 | -1.474 | -1.415 |
| -N-P | 0.000 | -2.255 | -2.373 | -2.048 | -1.997 | -1.695 | -1.533 | -1.970 | -1.501 |
|
-N+P: Nitrogen starved in the presence of P-factor -N-P: Nitrogen starved in the absence of P-factor |