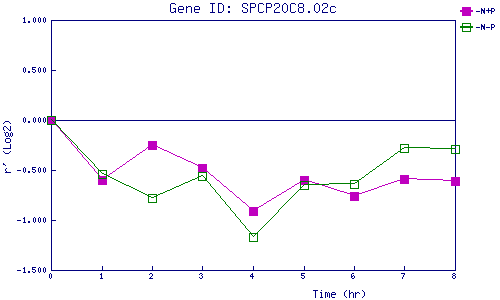
| 0 | 1 | 2 | 3 | 4 | 5 | 6 | 7 | 8 | |
| -N+P | 0.000 | -0.600 | -0.254 | -0.481 | -0.910 | -0.599 | -0.756 | -0.587 | -0.610 |
| -N-P | 0.000 | -0.545 | -0.776 | -0.564 | -1.172 | -0.651 | -0.635 | -0.278 | -0.294 |
|
-N+P: Nitrogen starved in the presence of P-factor -N-P: Nitrogen starved in the absence of P-factor |