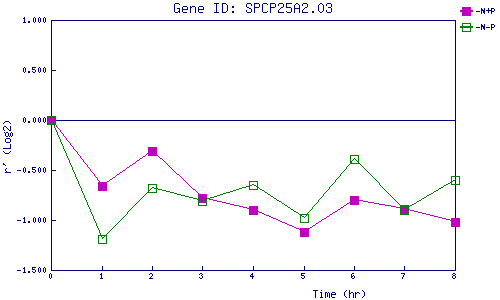
| 0 | 1 | 2 | 3 | 4 | 5 | 6 | 7 | 8 | |
| -N+P | 0.000 | -0.661 | -0.310 | -0.776 | -0.899 | -1.124 | -0.804 | -0.894 | -1.017 |
| -N-P | 0.000 | -1.186 | -0.684 | -0.813 | -0.652 | -0.979 | -0.387 | -0.901 | -0.597 |
|
-N+P: Nitrogen starved in the presence of P-factor -N-P: Nitrogen starved in the absence of P-factor |