| 0 | 1 | 2 | 3 | 4 | 5 | 6 | 7 | 8 | |
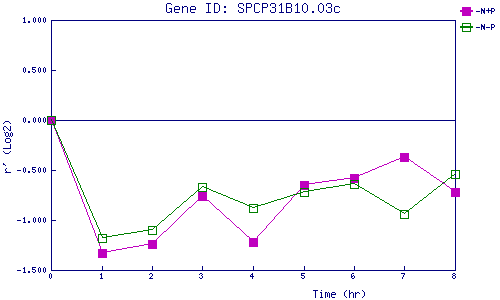
| -N+P | 0.000 | -1.327 | -1.237 | -0.756 | -1.215 | -0.654 | -0.580 | -0.370 | -0.720 |
| -N-P | 0.000 | -1.179 | -1.101 | -0.672 | -0.882 | -0.717 | -0.642 | -0.936 | -0.540 |
|
-N+P: Nitrogen starved in the presence of P-factor -N-P: Nitrogen starved in the absence of P-factor |