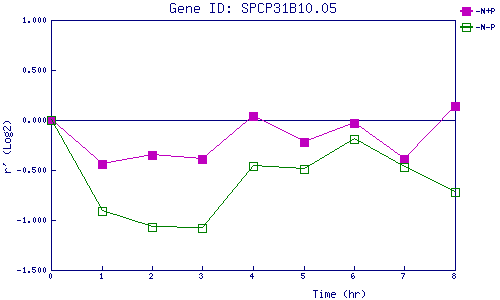
| 0 | 1 | 2 | 3 | 4 | 5 | 6 | 7 | 8 | |
| -N+P | 0.000 | -0.442 | -0.350 | -0.389 | 0.045 | -0.215 | -0.029 | -0.391 | 0.142 |
| -N-P | 0.000 | -0.914 | -1.068 | -1.081 | -0.462 | -0.488 | -0.188 | -0.467 | -0.715 |
|
-N+P: Nitrogen starved in the presence of P-factor -N-P: Nitrogen starved in the absence of P-factor |