eft202
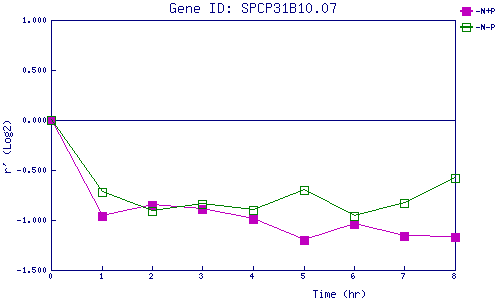
| 0 | 1 | 2 | 3 | 4 | 5 | 6 | 7 | 8 | |
| -N+P | 0.000 | -0.955 | -0.848 | -0.888 | -0.990 | -1.197 | -1.039 | -1.162 | -1.168 |
| -N-P | 0.000 | -0.719 | -0.908 | -0.842 | -0.900 | -0.696 | -0.959 | -0.830 | -0.581 |
|
-N+P: Nitrogen starved in the presence of P-factor -N-P: Nitrogen starved in the absence of P-factor |