rpl35a rpl33
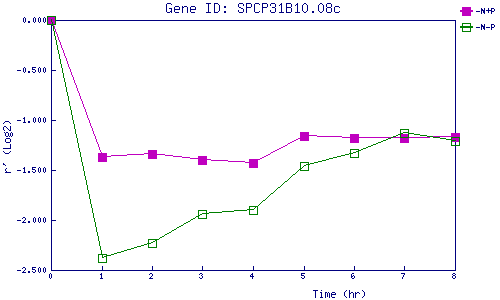
| 0 | 1 | 2 | 3 | 4 | 5 | 6 | 7 | 8 | |
| -N+P | 0.000 | -1.372 | -1.340 | -1.398 | -1.433 | -1.157 | -1.183 | -1.179 | -1.174 |
| -N-P | 0.000 | -2.382 | -2.234 | -1.942 | -1.904 | -1.457 | -1.330 | -1.134 | -1.206 |
|
-N+P: Nitrogen starved in the presence of P-factor -N-P: Nitrogen starved in the absence of P-factor |