ade10
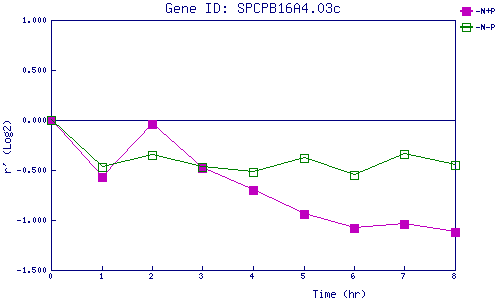
| 0 | 1 | 2 | 3 | 4 | 5 | 6 | 7 | 8 | |
| -N+P | 0.000 | -0.573 | -0.040 | -0.484 | -0.701 | -0.945 | -1.079 | -1.041 | -1.116 |
| -N-P | 0.000 | -0.470 | -0.346 | -0.468 | -0.524 | -0.378 | -0.547 | -0.344 | -0.450 |
|
-N+P: Nitrogen starved in the presence of P-factor -N-P: Nitrogen starved in the absence of P-factor |