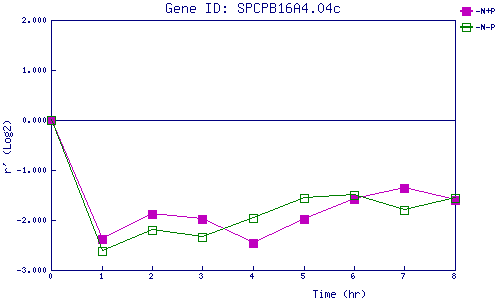
| 0 | 1 | 2 | 3 | 4 | 5 | 6 | 7 | 8 | |
| -N+P | 0.000 | -2.383 | -1.873 | -1.985 | -2.464 | -1.971 | -1.580 | -1.356 | -1.597 |
| -N-P | 0.000 | -2.617 | -2.200 | -2.343 | -1.963 | -1.565 | -1.500 | -1.809 | -1.550 |
|
-N+P: Nitrogen starved in the presence of P-factor -N-P: Nitrogen starved in the absence of P-factor |