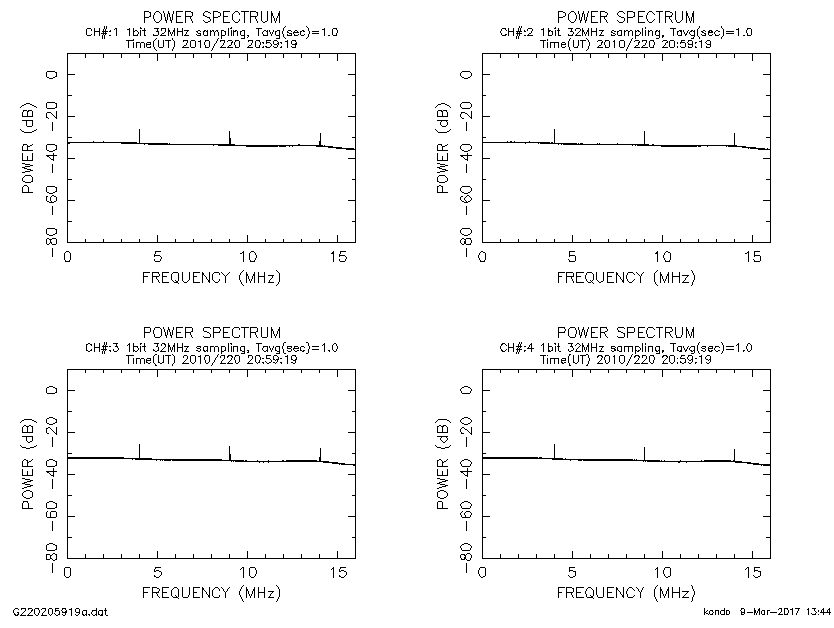
Figure 1. Four spectra displayed by "speana" for 64MHzX1bitX4ch sampling data.
| speana |
|---|
| DESCRIPTION |
|---|
"speana" displays spectrum of sampling data (dedicated to K5/VSSP format)
| SYNOPSIS |
|---|
speana k5name [options]
| k5name | sampling data file name with K5/VSSP format | ||||||||||||
| OPTIONS | |||||||||||||
| -m[ode] mode | set axis mode or autocorrelation mode | ||||||||||||
| |||||||||||||
| -p[mode] pmode | plot device selection | ||||||||||||
| |||||||||||||
| -se[kibun] sekibun | set integration period (sec) | ||||||||||||
| -ti[ntegration] sekibun | same as "-se sekibun" option | ||||||||||||
| -i[ntegration] sekibun | same as "-se sekibun" option | ||||||||||||
| -co[mment] comment | comments appeared in graphics | ||||||||||||
| -so[ffset] soffset | start time offset (sec) (default 0.0) | ||||||||||||
| -to[ffset] soffset | same as "-so soffset" option | ||||||||||||
| -o[ffset] soffset | same as "-so soffset" option | ||||||||||||
| -f1[khz] f1khz | set search frequency range (lower boundary) (kHz) for power Maximum (default is 0.0) | ||||||||||||
| -f2[khz] f2khz | set search frequency range (upper boundary) (kHz) for power Maximum (default is video frequency) | ||||||||||||
| -min[dbm] mindbm | display amplitude minimum (dBm) (default auto) | ||||||||||||
| -max[dbm] maxdbm | display amplitude maximum (dBm) (default auto) | ||||||||||||
| -nops | same as "-p 2" option (no postscript out) | ||||||||||||
| --version | show program version | ||||||||||||
| --help | show how to execute |
| ENVIRONMENT VARIABLES |
|---|
| PGDISP | default PGPLOT display device |
| EXAMPLE |
|---|
Fig.1 shows an example of display of spectra in case of 64MHzX1bitX4ch sampling data.