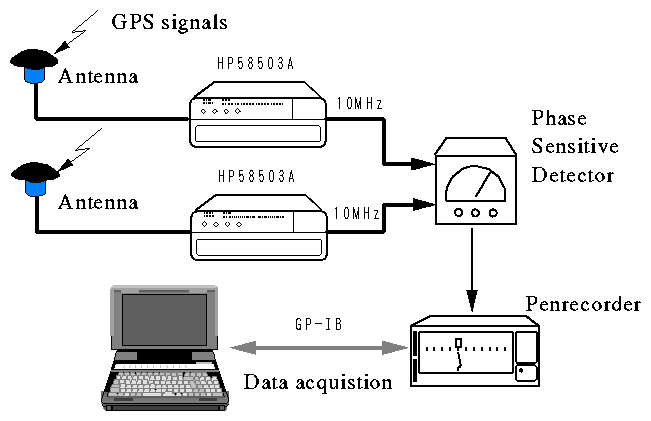
Figure 1. Schematic block diagram of observation system.
1 Kashima Space Research Center
Communications Research Laboratory
893-1 Hirai, Kashima, Ibaraki 314-0012, Japan
2Communications Research Laboratory
4-2-1 Nukui-kita, Koganei, Tokyo 184-8795, Japan

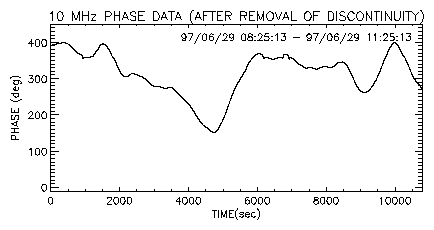
There are 72 discontinuities in raw phase data spanning 6 days due to inherent characteristics of the comparator, i.e., a trip of 360 degree occurs when the phase crosses the 360 or 0 degree boundary. These discontinuities should be removed before further statistical analysis is carried out. Figure 2 shows the observed phase after removal of discontinuity. Small data discontinuities still remain in the data.
The Allan variance is a good measure for evaluating stability of reference
signals. We calculated the Allan variance at an averaging time tau from the
phase data at 10 MHz as follows,

where

where phi(tk) is the phase at time tk
and nu0 is the frequency
at which the
phase measurement is made (=10 MHz). We divide phase data into 24 sets of 6
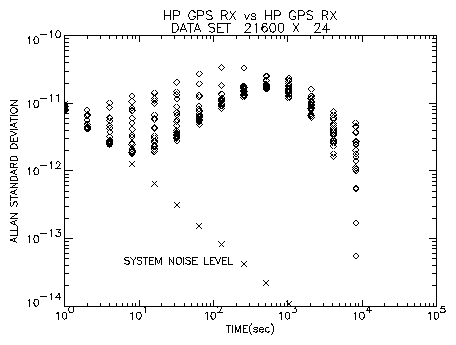
hour spans. Figure 3 shows the Allan variances calculated for each
phase data set. The results show stability of better than 10-11 for
an averaging time range less than 1000 sec. This is almost the same performance
expected from specifications of the receiver. Scatter on the plots seen for
time range less than 1000 sec is attributed to small discontinuities
still left in the phase data as mentioned before. System noise level is
sometimes larger than the receiver performance for the time range less than 10
sec. However we can say that it reaches the level described as typical
characteristics in the specifications of the receiver, i.e.,
~2x10-12 at 10 sec.
Next we evaluate coherence loss when this frequency standard is applied to S
(2.2 GHz) and X (8.8 GHz) band observations. Using measured phase data,
coherence after N sec integration is calculated as follows,

where C is a ratio of observation frequency and 10 MHz, i.e., 220 and 880 for
2.2 GHz and 8.8 GHz respectively, and phi(tn)
is a phase at time tn. We
assume no coherence loss for 1 sec integration. Coherence calculated this way
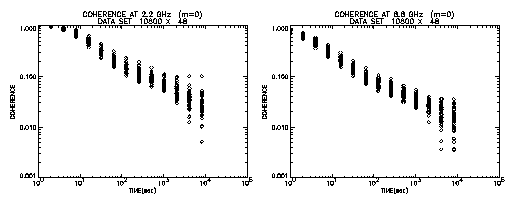
is shown in Figure 4. In this calculation phase data are divided into 48 sets
of 3 hour span. As shown in the figure coherence decreases as the integration
period increases. Even at 10 sec integration they are down to about 0.7 and
about 0.3 for 2.2 GHz and 8.8 GHz, respectively. They are further decreased
down to 0.1 for 100 sec integration, which is a typical accumulation period in a
geodetic VLBI. Therefore it seems to be difficult to adopt for VLBI
observations.
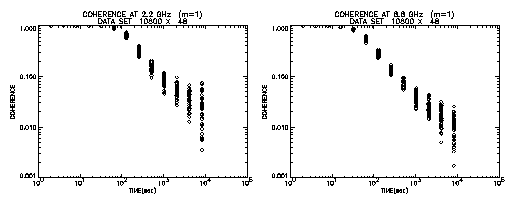
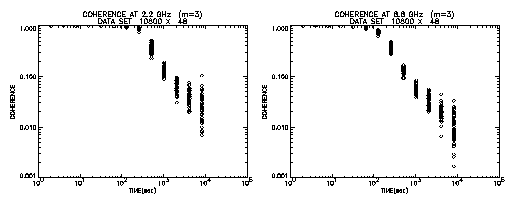
Fringe searches in VLBI correlation processing are relevant to this problem. Correlator outputs integration results every second or every several seconds. These time segmented data are further integrated with phase change being adjusted by a time-linear function to maximize integrated correlation amplitude. This process is called a "fringe search". We adopt a similar technique in a calculation of coherence. Firstly phase variation during accumulation period is fitted by a polynomial function using a least squares method. Then we calculate coherence using residual phase after fitting. We use a polynomial of degree 1 to 3.
Figure 5 shows results in case of the first order polynomial being adopted. This is the case just like a "fringe search" in geodetic VLBI processing. We can see remarkable increase in coherence. At 100 sec, almost no loss can be seen for 2.2 GHz. Even for 8.8 GHz, coherence keeps value of 0.3. Figure 6 presents results when a third order polynomial is adopted. It is seen that an integration period without loss can extend to about 300 sec for 2.2 GHz and about 100 sec for 8.8 GHz. Thus adopting the fringe search process for integration, the GPS Time and Frequency Reference Receiver can be used as a frequency standard for VLBI observations made at S and X bands. However, the \pagebreak observed delay time obtained this way should be carefully examined for utilization in further analysis such as a baseline length analysis, because clock stability is an important factor to connect a scan, which is a continuous observation of a radio source, between neighboring observations in further analysis, and fluctuation of the clock between observations remains as an unknown parameter.
