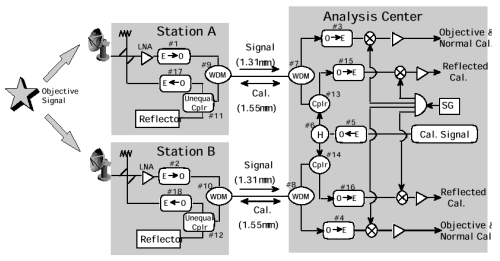
Figure 1. System configuration of the optical-linked RF interferometer.
Communications Research Laboratory
4-2-1 Nukui-kita, Koganei, Tokyo 184-8795, Japan

Delay changes that occur in the optical fibers are compensated for by the calibration signals, which make a round trip between the analysis station and the observation sites. We usually use comb tones for the calibration signal [Rogers, 1970], but a noise can also be used. The use of comb tones is assumed for the estimation of the practicable cable length (described in the next section). A calibration signal at radio frequency (cal. signal) is generated at the analysis station, converted to an optical signal on the carrier at the wavelength of 1550 nm (#5), and divided into two signals by an optical power divider (#6). Then each divided signal is transmitted using a wavelength division multiplexer (WDMs #7 or #8) to each observation site through the same optical fiber that feeds the objective signal. At each observation site the calibration signal is selected out again by a WDM (#9 or #10) and then by using an optical coupler with unequal divide ratio (#11,#12) it is divided into two optical signals with different intensity: normal cal. signal and reflected cal. signal. The normal cal. signal is converted to an electric signal at the observation site (#17 or #18) and is injected into the receiving system through a directional coupler installed just before the LNA. The normal cal. signal is processed as the phase calibration signal of a usual geodetic VLBI. The reflected cal. signal is directly reflected by an optical reflector and returns to the analysis station through the same optical fiber. At the analysis station, the returned reflected cal. signal is selected out by the WDM (#7 or #8) and is fed to a photo detector (#15 or #16) via the optical directional coupler (#13 or #14). The reflected cal. signals converted to electric signals for both stations are converted to lower frequency and processed in the same manner as the normal cal. signal.
The equivalent input noise analysis of the optical link with an Ortel 3541A laser diode and an Ortel 4515A photo detector shows that the practicable cable length to maintain coherence of the objective signal was estimated to be less than 63.3 km [Amagai, et al., 1996].
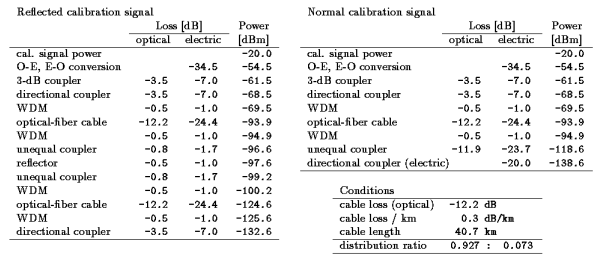
The conditions for the normal cal. signal and the reflected cal. signal are restricted by the input and output powers. The power of one calibration signal tone at the input of the laser diode is $-20$ dBm; i.e., the calibration signal consists of the comb tones with a frequency interval of 10 MHz and a bandwidth of 1 GHz, and maximum input power of the laser diode is 0 dBm. The power of one normal cal. signal tone at the injection point at the antenna site should be 10 dB higher than the noise power level of $-148.6$ dBm/kHz (the equivalent noise temperature of the low-noise amplifier is assumed to be 100 K), and the power of one reflected cal. signal tone at the output of the photo detector at the analysis station should be 10 dB higher than the noise power level of $-142.6$ dBm/kHz (thermal noise of the photo detector is assumed to be 300 K and equivalent noise temperature of the amplifier following the photo detector is assumed to be 100 K). We estimated the maximum cable length of the optical fiber according to the above conditions with controlling the distribution ratio of the unequal coupler installed at the antenna site. Table 1 lists the results of the estimation. The maximum cable length is estimated to be 40.7 km. In this condition, distribution ratio of the unequal coupler should be 0.927:0.073. Consequently, the practicable cable length is estimated to be less than 40.7 km.

We evaluated the delay compensation method mentioned in Section 2. We determined the group delay using the least squares method applied to the spectra of phase differences between two receiving systems. The phase delay can be calculated by dividing the phase difference at the center frequency (8300 MHz) by the radio frequency. We prepared one 10-m cable, two 5-m cables, and one 3-m cable and measured the delays for four pairs of these cables. Delays after the delay compensation are expected to be 0 because the common objective signal was fed into both receiving systems.

Table 2 lists the measured group delay and the phase delay for four pairs of cables. The errors listed in the table were calculated from the phase residuals after least square fitting. The determination precision of the phase delay is more than 100 times better than that of the group delay. The results show that every observed delay was less than 100 psec and the cable delays were almost compensated for successfully, however for group delays there still remains significant uncompensated delay for the cases of the cable length differences of 7, 5 and 2 m. The ambiguity of the phase delay is a half of the radio frequency; i.e., 60.2 psec in this case. The observed group delay should thus be within +/- 30 .1 psec to get the correct phase delay. Though we could not get the correct phase delay, except for the cable length difference of zero, the phases for every frequency component after delay compensation were less than 10 deg and were not consistent with the observed group delay. The observed group delays were therefore apparent and the cable delay compensation was thought to be properly applied. The phase delays listed in Table 2 were calculated by using expected ambiguity instead of observed group delay. Though total band width was limited to 400 MHz by the instrument available for this experiment, a system with the bandwidth of 1 GHz is now available. Using the system with such a wide bandwidth, we can improve the precision of determining group delay and, consequently, the ambiguity problem mentioned above can be resolved.
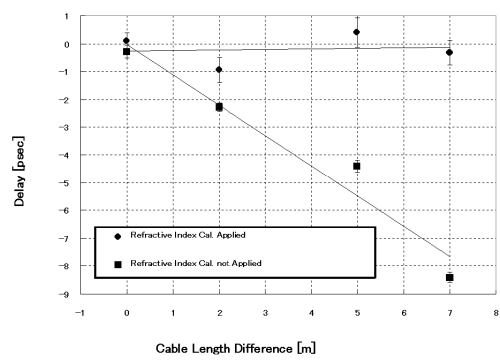
Figure 2 shows the observed phase delays obtained with delay compensation using a reflected cal. signal and those obtained with not using a reflected cal. signal. For the latter case, we used nominal refractive indexes of 1.44692 for the wavelength of 1310 nm and 1.44402 for that of 1550 nm to compensate the effect caused by the difference of refractive indexes. The figure shows that an expected phase delay of zero was observed when using a reflected cal. signal for each cable length difference except 2 m. We can also see that the absolute value of the phase delay obtained without a reflected cal. signal increases proportionally to the cable length difference. The reason for this proportional increase is thought to be due to the incorrectness of the refractive indexes. From this experiment, we confirmed that by using the reflected cal. signal we can measure absolute delay within an error of 100 psec for group delay and 1 psec for phase delay.

The results of preliminary experiments with this interferometer lead to the conclusion that the optical-fiber delay is successfully compensated for (within an error of 100 psec for group delay and 1 psec for phase delay) by calibration signals in the radio-frequency range. Though we demonstrated that we can determine the absolute delay not only for group delay but also for phase delay, we should note that it is difficult to use phase delay for an actual experiment where an objective signal passes through a dispersive medium because the phase delay does not directly correspond to the group delay in such a condition.
In future research, we will conduct an experiment with a real radio-interferometer system to demonstrate the effectiveness of the optical-linked RF interferometer.
Rogers, A. E. E., Very Long Baseline Interferometry with effective band width for phase- delay measurement, Radio Science, vol.5, no.10, pp.1239-1247, Oct. 1970.
Kiuchi, H, et al., K-4 VLBI Data-Acquisition system, Publ. of Astron. Soc. of
Japan, vol.49, no.6, 1997.