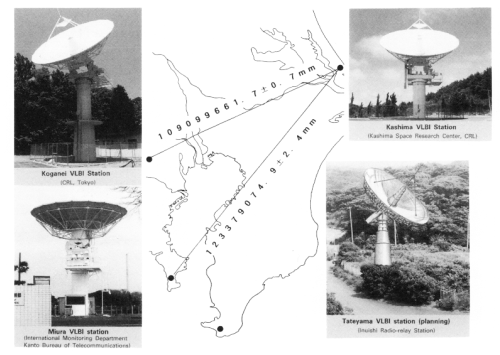
Figure 1. Configuration of KSP and the baseline length.

The results in the daily test VLBI experiments from 31th January to 6th September (in the period of about 7 months) are described as follows:
Because of the test observations, we make a baseline analysis using
the other software "SOLVE" which was developed by GSFC (NASA), and we
describe these results since the repeatability of these results is a
little better than those by automatic analysis software.
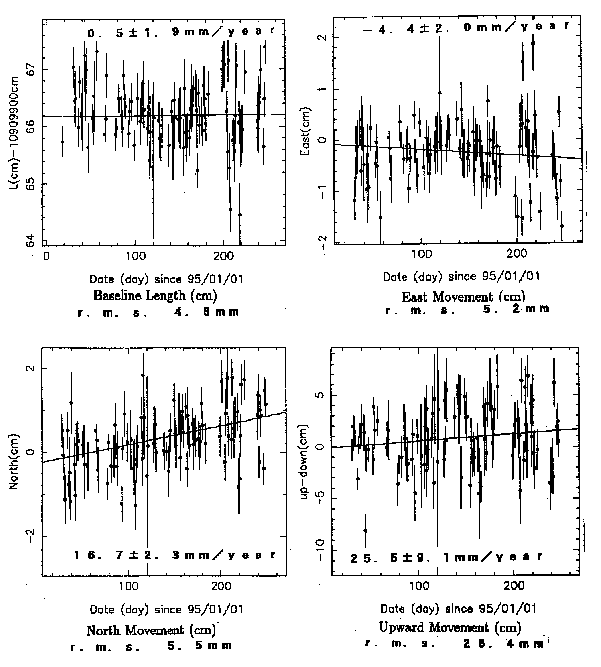
Figure 2 shows the change in the distance on the Kashima-Koganei baseline, and the changes in the position of Koganei (east movement, north movement, upward movement) against Kashima station (when the position of Kashima is fixed). Table 1 shows the summary of the precision. For the horizontal movements and baseline length, the precision and repeatability are about 5mm, and the precision for the vertical movement is about 2.5cm in spite of the test experiments of 56 Mbps mode. For the regular experiments of 256 Mbps mode, the precision will become one third of these results.
   Table 1. Precision and repeatability in KSP test daily experiments.
 =========================================================================
                    Mean        Repeat-              Koganei
                    Precision   ability    -----------------------------
                                            Position error    Change
                     (mm)        (mm)            (mm)        (mm/year)
 -------------------------------------------------------------------------
 Baseline Length      3.2        4.6           +/-0.7       0.5+/-1.9
 East Movement        3.4        5.2           +/-0.8      -4.4+/-2.0
 North Movement       4.1        5.5           +/-1.0      16.7+/-2.3
 Upward Movement     17.0       26.4           +/-3.3      25.5+/-9.1
 =========================================================================
The position changes are described in the different methods. At first,
one or several stations are fixed using the tectonic model, and the
position changes in the other observed stations are obtained against the
fixed stations. This method is useful to obtain the deformation of the
observation net. Secondly, the movements are described for the
international velocity field, such as ITRF (International Terrestrial
reference Frame) or the velocity field of GSFC. Finally, the movements
are described as the displacement from the plate motion. Figure 3 shows
the movements of Koganei and Kashima stations. We also have the results
by other experiments, which is call "MDX (Metropolitan Diamond Cross)".
These experiments were conducted among Kashima 34m antenna, Koganei 3m
antenna, and GSI 5m antenna since 1988 once or twice every year. We
show both sets of results. Figure 3 shows these station movements. Figure
3-(a) shows the movement of Koganei station relative to Kashima station.
Figures 3-(b),(c) are the movements of Koganei and Kashima stations for
the displacement from North American Plate motion in the reference of
the GSFC velocity field in 1993, and in the reference of the ITRF
velocity field in 1993. Figure 3-(d) shows the movements in the reference
of the ITRF velocity fields in 1993. Figure 3-(e) is the plate motion
on the plate boundary.
In the Alaska area, the station movements for the displacement from the North American Plate motion are similar to the direction of the Pacific plate motion on the plate boundary. In the Japanese area, the movements of the Kashima and Koganei stations in both KSP and MDX experiments are similar to the direction of the Pacific Plate motion and the Philippine Sea Plate motion shown in Figure 3-(e). It is possible that the deformation is caused by the pressure of the plate motion. The movements obtained from KSP experiments are different from those from MDX experiments. Furthermore, the results appear to differ according to which velocity field is used as a reference.
In Japan, many GPS stations and several VLBI and SLR stations are
observed, and the results are collected. The reference of the velocity
field may become important.
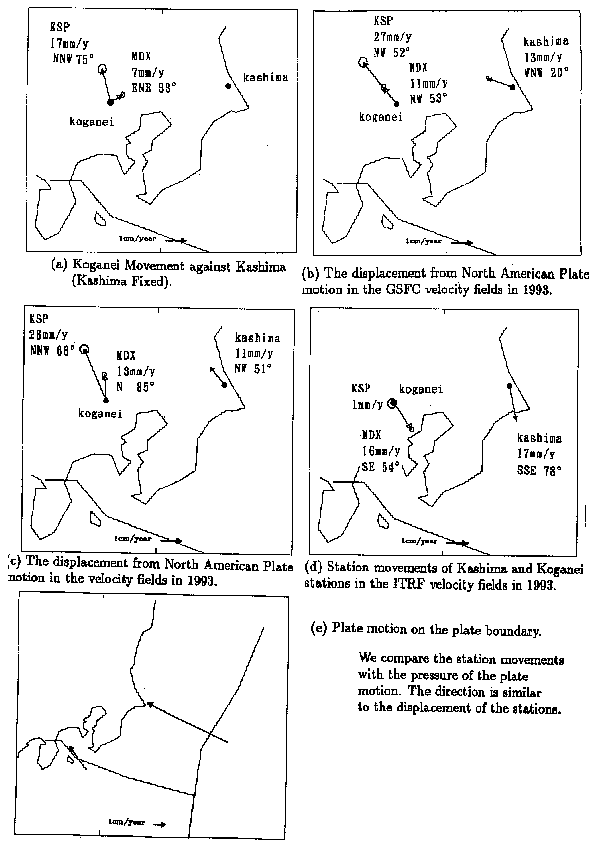
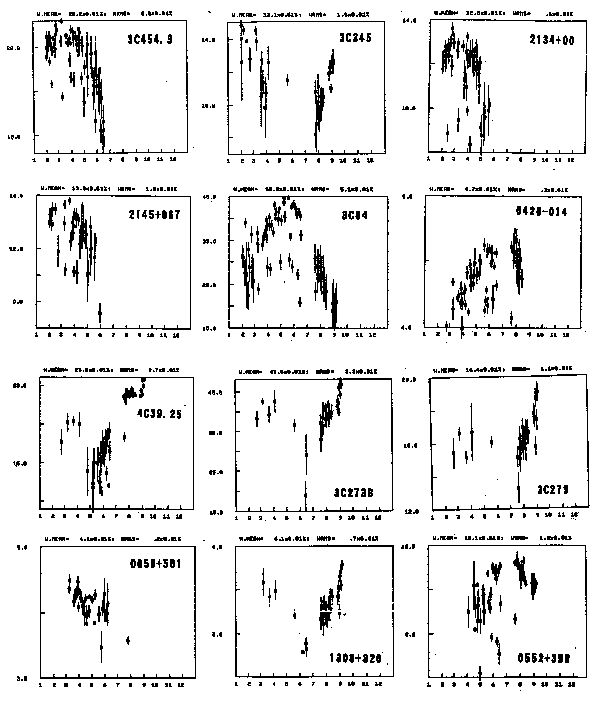
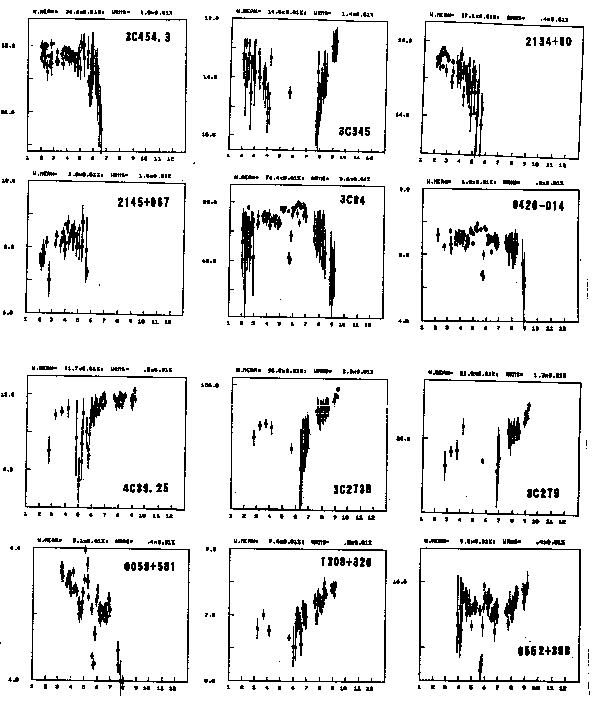
Figure 5. The change in the correlated amplitude at S band
on Kashima-Koganei baseline without the correction.
The motion of Koganei station relative to Kashima station are measured. The movements are slightly different from those inferred from MDX VLBI experiments. However, the displacement from the North American Plate motion is similar to the direction of the pressure of the plate motion on the plate boundary. The movements of the other VLBI stations, at Tsukuba and Kanozan, are also the same direction.
The indication of the station movements differens according to the velocity field that is used as a reference. It is important that the reference velocity field should be common since the comparison of the different analyses and different equipment should be not confused.
We also obtain the continuous changes in the correlated flux density in KSP experiments. These changes are useful in characterizing the burst changes of the quasar.
The KSP will be completed in next year, and we will obtain the positions of 4 stations with the precision of 2-3mm using daily VLBI and SLR. Furthermore, the real time VLBI using 256 Mbps data transfer by optical fiber cable will be started during the next year.