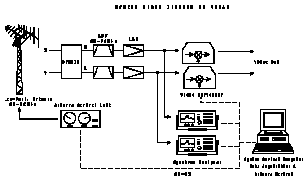
 Figure 1. A schematic block diagram of KaRAS system.
Kashima Radio Spectrograph (KaRAS) was constructed at Kashima Space Research
Center for observing decametric radio emissions from the sun and Jupiter. In
particular KaRAS is designed to form an interferometer in combination with
a similar system at
Hiraiso located about 40 km north. The KaRAS consists of a wide band antenna
system, two swept-frequency type spectrum analyzers and a video converter system
for a future interfereometer use (Fig.1).
 Figure 1. A schematic block diagram of KaRAS system.
A wide band antenna is a crossed log-peri antenna mounted on the top of 15-m high tower as an AZ-EL type mount. Its nominal receiving frequency range is 25-70 MHz. Received crossed linear polarized component signals are fed to a hybrid circuit to form a right handed and a left handed circularly polarized component signals. Both right- and left- polarized signals are amplified and then fed to the two spectrum analyzers. Data from spectrum analyzers are acquired by a system control computer (HP Vectra) through the GP-IB interface. The data are transfered to a UNIX workstation (HP9000/730) to produce a spectrogram and to perform further analyses.
Development of observation control software has been completed and daily observations were started in July, 1996. The object is selected automatically. In the daytime, the sun is tracked. At present, Jupiter is observed when it is in the sky during nighttime. Receiving frequency range of spectrum analyzer is also controled automatically according to the target. It is set 20-70 MHz for the sun, and 25-35 MHz for Jupiter. This difference comes about due to the characteristics of each emission. For Jovian decametric radio wave emissions, the intrinsic lower frequency limit is about 38 MHz.
Observations of radio waves at lower frequencies are becoming more difficult in recent years due to the increase of man-made noise such as TV broadcasts and other telecommunication signals. KaRAS observations are also affected by this interference. To improve the signal-to-noise ratio of spectrograms under these difficult conditions, we have developed computer software which eliminates man-made interference as much as possible.
In this process, first we subtract the background from raw spectral data.
Background level is calculated as a time average (~1 hour) of each sweep
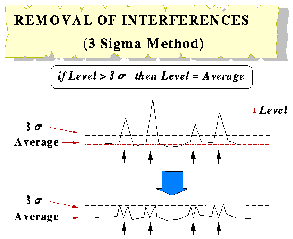
spectrum data. Then we adopt the following 3-sigma criterion to eliminate
interference signals still remaining on a spectrogram
(Fig.2).
 Figure 2. A simple 3-sigma method for removing noise.
First, the running average
and standard deviation of a given frequency span is calculated for each sweep.
Any data points with deviations larger than 3 sigma are replaced
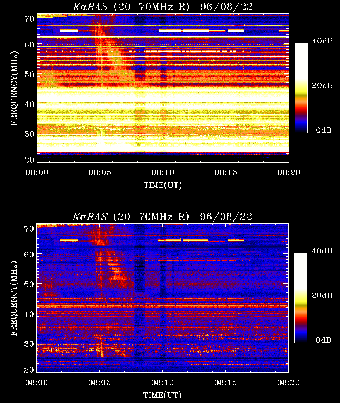
by an adjacent data values. This simple algorithm is considered to be working
properly for actual data as shown in Fig.3.
 Figure 3. Raw (top) and processed (bottom) spectrograms.