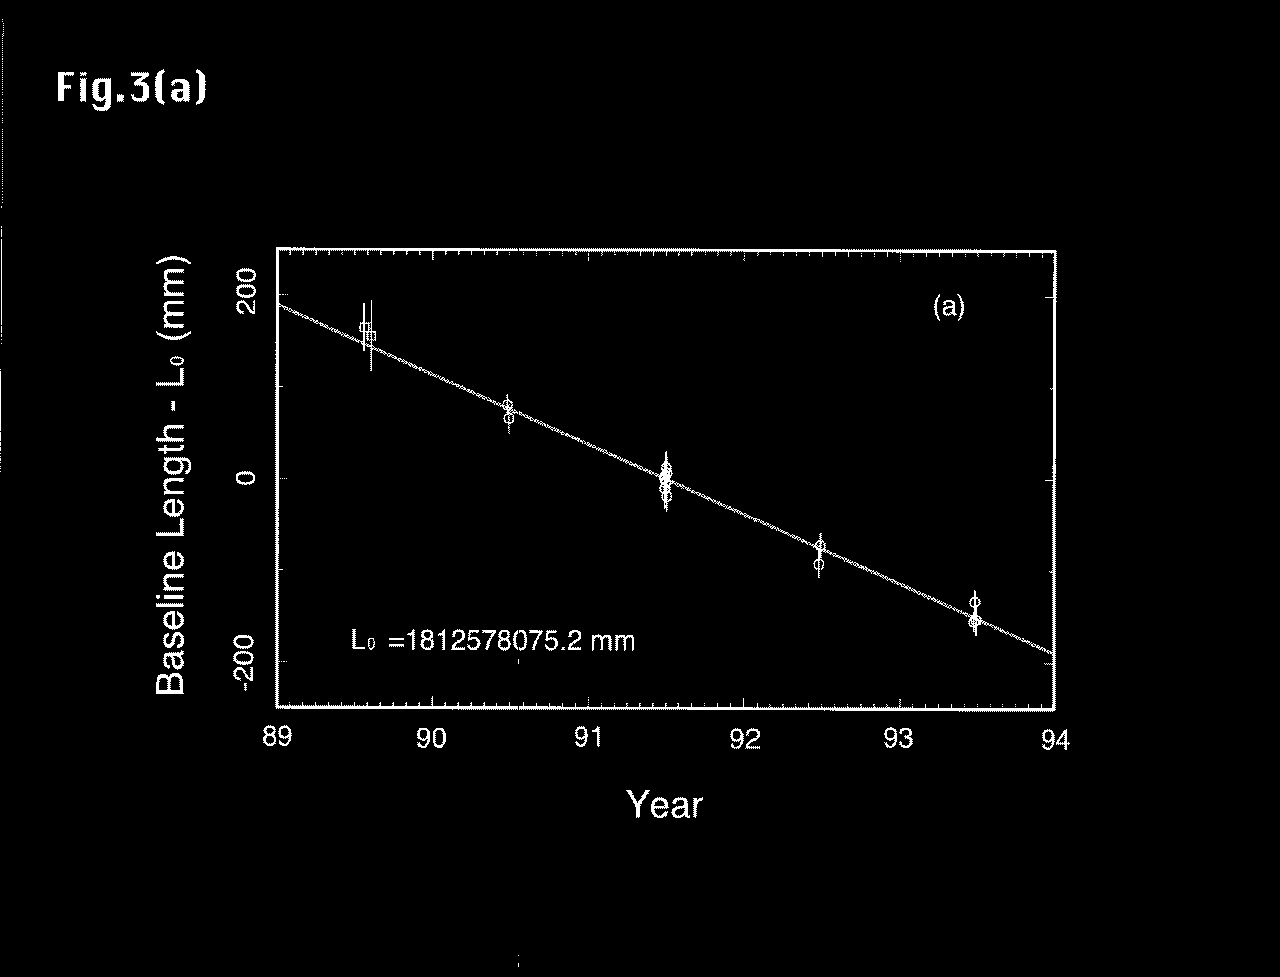
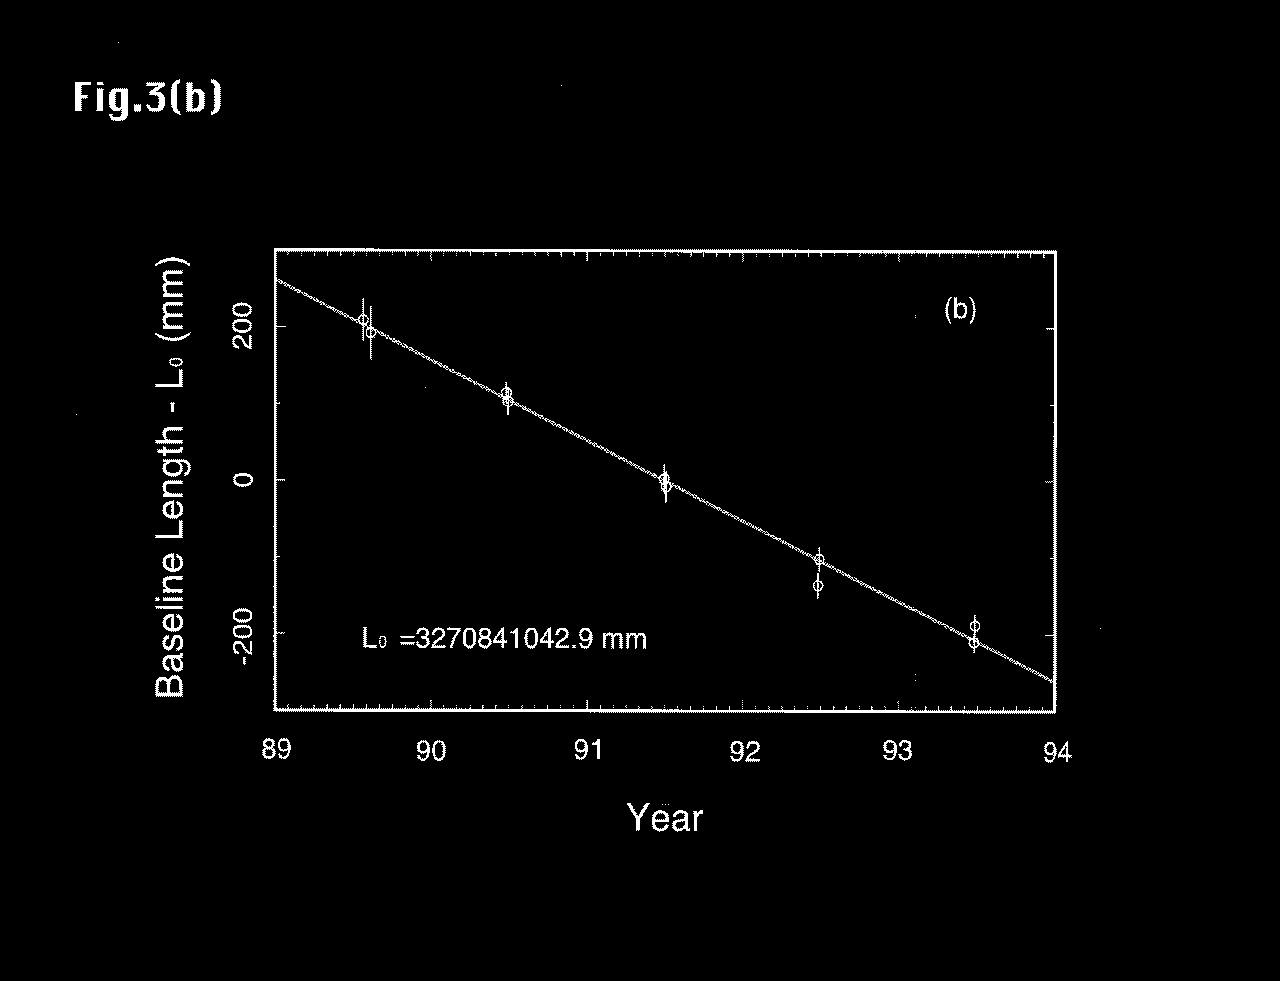
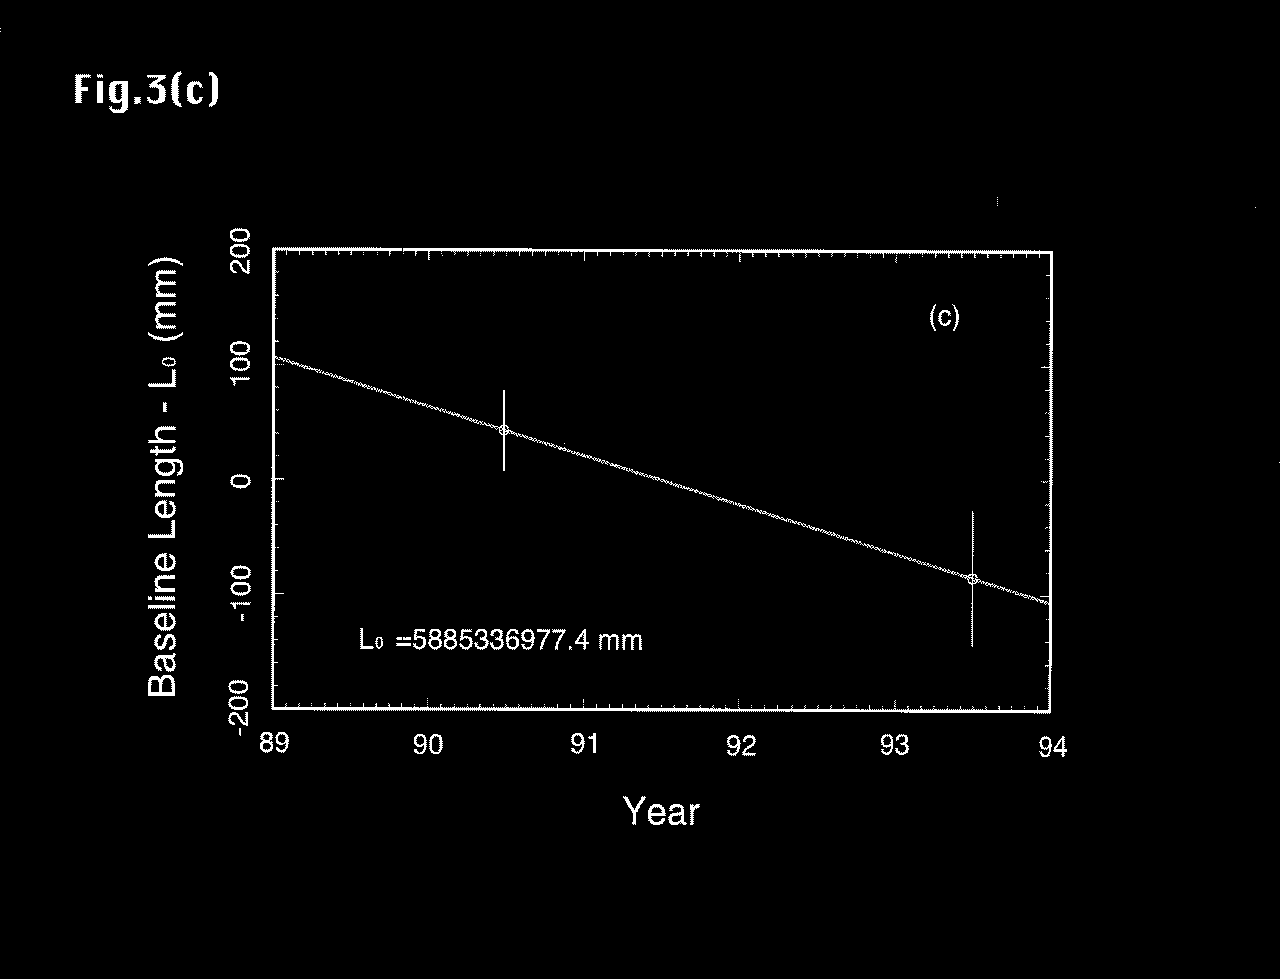
III-1. Movements of the Minamitorishima Station (Fifure 3)
by Yasuhiro KOYAMA et al.
(a)

(b)

(c)

Figure 3
Baseline length plots from WPVN experiments. Each point
is plotted with 1$\sigma$ error bar. Straight lines are results
of least-squares estimations by assuming a constant change of each
baseline length. Two open squares in the Kas34-Minamitorishima
baseline plot indicate these data were actually calculated from
Kas26-Minamitorishima baseline lengths.
Any comments or request for pre-prints,
please contact me.
Last Update: Feb. 21, 1995


